Solar panels in Westfield: what they cost and what they make
A typical Westfield home needs 21 solar panels. They would make about 11,300 kWh a year and cost $22k to $33k before incentives. At today's electricity prices they pay for themselves in about 13.5 yrs.
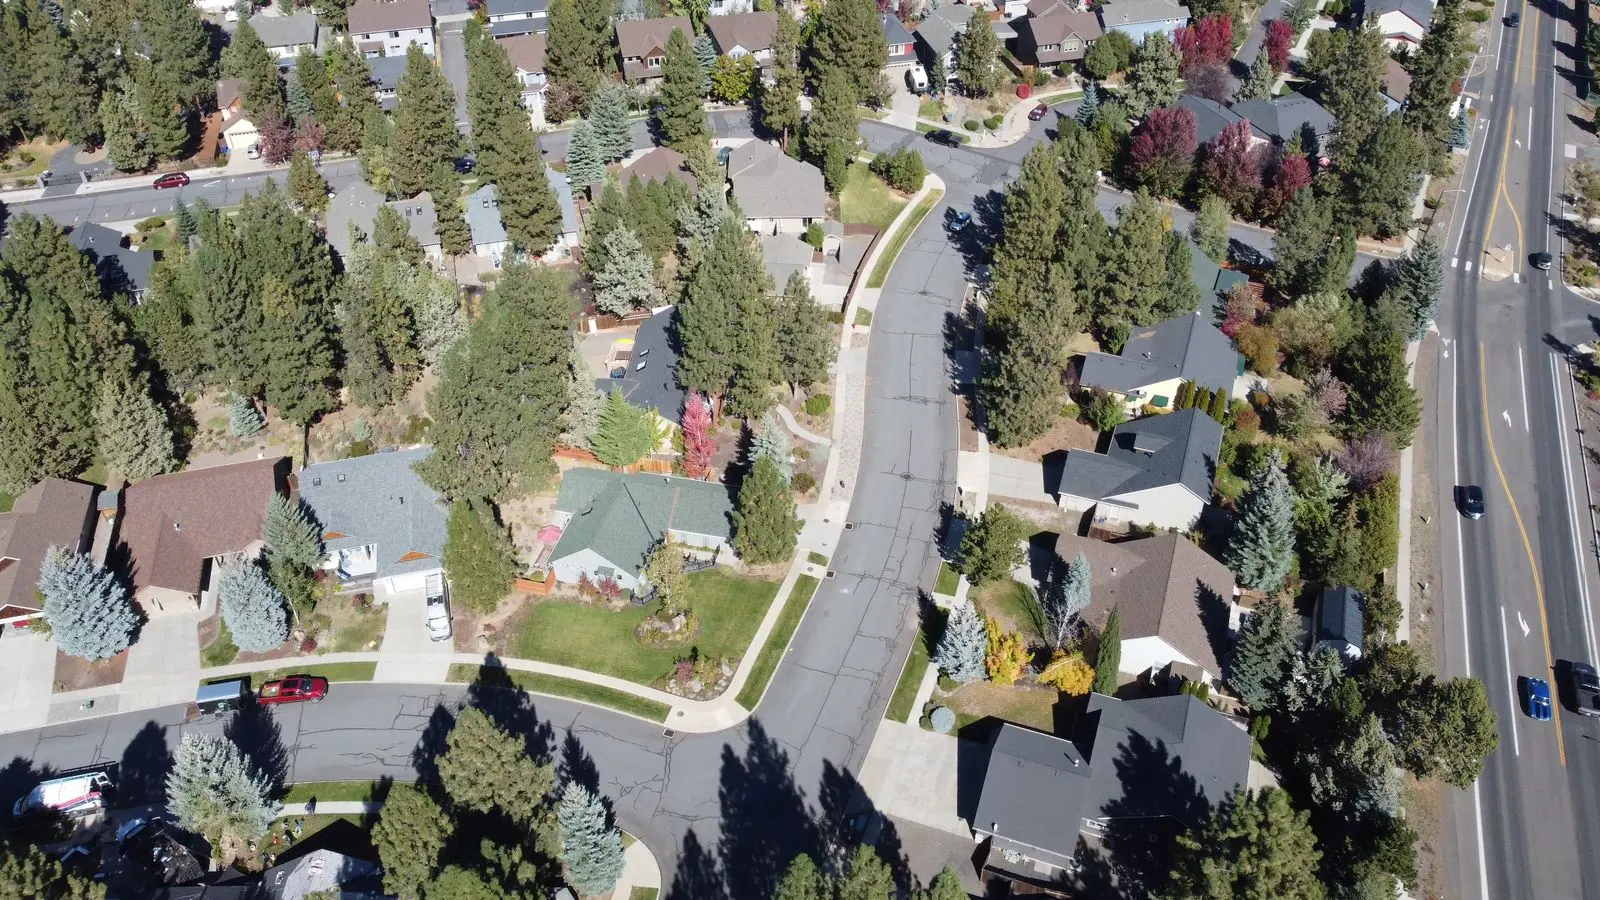
See panels on your own Westfield roof
Type your address. You get your roof from above, the panels that fit, a month-by-month forecast and a battery test. No phone number.
What solar costs in Westfield
At $3.00 a watt, the median price cash buyers pay nationally, a 8.8 kW system costs about $26,400. Quotes in Westfield will usually fall between $22,000 and $33,000. Complex roofs, main-panel upgrades and financing push prices up.
The 30% federal tax credit no longer applies to systems homeowners buy. This estimate includes no state or utility incentives; check with your utility before you buy.
The number that decides whether solar pays in Westfield is what your utility pays for the power you send back. Under full payback is about 13.5 yrs. Under net billing it is about 21.9 yrs, because only the ~43% of solar a typical home uses as it is made saves the full retail price.
Cash purchase, prices rising 2.5% a year, panels losing 0.5% a year, $25/kW a year for upkeep. No federal credit for homeowner-owned systems.
Every way to pay for a 8.8 kW system in Westfield
Change any number →| Way to pay | Day one | Monthly payment | Monthly net, year 1 | Ahead after 25 years |
|---|---|---|---|---|
| Pay cash Full price on install day | $26,400 | $0 | +$142 | $30k |
| Credit-union loan 8% APR, 20 years, no dealer fee | $0 | $221 | −$79 | $3,100 |
| “1.99%” solar loan 1.99% APR, 25 years, 25% dealer fee | $0 | $140 | +$2 | $14k |
| Lease $135/mo, +2.9%/yr | $0 | $135 | +$25 | $3,300 |
| Power purchase (PPA) 14.5¢/kWh, +2.9%/yr | $0 | $137 | +$24 | $6,400 |
Under net metering, at 17.0¢/kWh rising 2.5% a year. The “1.99%” loan’s $6,600 dealer fee is included in its payments. Lease and PPA prices are typical offers, not quotes.
How much sunshine Westfield gets
kWh per kW, 25° southJul is the best month for solar in Westfield, and Dec the weakest: a Dec day makes 42% of a Jul day. A 6 kW system would make about 352 kWh in Dec and 834 kWh in Jul.
On June 21 the sun rises at 6:15 am and sets at 9:17 pm, 15 hours 1 minutes of daylight. On December 21 it is up from 8:03 am to 5:22 pm, just 9 hours 19 minutes.
Peak sun hours in Westfield, month by month
| Month | Flat ground | Panels at 35° | kWh per kW |
|---|---|---|---|
| Jan | 1.8 | 2.8 | 68 |
| Feb | 2.6 | 3.7 | 81 |
| Mar | 3.7 | 4.5 | 110 |
| Apr | 4.8 | 5.1 | 124 |
| May | 5.5 | 5.3 | 131 |
| Jun | 6.2 | 5.7 | 135 |
| Jul | 6.2 | 5.7 | 139 |
| Aug | 5.6 | 5.7 | 134 |
| Sep | 4.5 | 5.4 | 121 |
| Oct | 3.1 | 4.4 | 102 |
| Nov | 2.1 | 3.5 | 78 |
| Dec | 1.5 | 2.5 | 59 |
| Year | 4.0 | 4.5 | 1,281 |
A peak sun hour is one hour of sunlight at 1,000 W per m². Why sites disagree.
The best angle and direction for panels in Westfield
| Roof faces (6/12 pitch) | Output vs south | kWh per kW |
|---|---|---|
| South | 100% | 1,281 |
| Southeast | 96% | 1,230 |
| Southwest | 95% | 1,217 |
| East | 84% | 1,076 |
| West | 84% | 1,076 |
| North | 63% | 807 |
Face panels south and tilt them 35° for the most energy over a year. East and west roofs keep about 84% of that. A north-facing roof keeps 63%, which is rarely worth the money. Try other angles.
Where the sun goes over Westfield
The noon sun is lower in winter, which is why the best winter tilt (62°) is steeper than the best summer tilt (11°).
Westfield's homes
Westfield has 20,984 households. 79.5% own their home, and 16,490 of those owners live in single-family houses, the kind of home that usually gets rooftop solar.
The median home here was built in 2010. Most roofs this young have years of life left, which makes them good candidates for solar.
34% of homes heat with electricity and 63.7% with gas. If you switch to a heat pump or an electric car, plan for more panels or leave room on the roof.
Source: U.S. Census Bureau, American Community Survey 2020–2024 5-year estimates.
If the power goes out in Westfield
Solar panels alone shut off in a blackout. Add a battery and they keep going. One Tesla Powerwall 3 (13.5 kWh) running a fridge, freezer, furnace fan, lights, Wi-Fi, TV and microwave (6.9 kWh a day):
Change the appliances, the battery and the weather in the battery calculator.
Questions people ask about solar in Westfield
How much do solar panels cost in Westfield?
A 8.8 kW system — enough for the average Indiana home — costs about $22,000 to $33,000 before incentives, based on $2.50–$3.75 per watt. The 30% federal credit no longer applies to systems homeowners buy.
How many solar panels does a house in Westfield need?
About 21 panels of 420 watts for a home using 901 kWh a month, the Indiana average. Each kilowatt of panels here makes about 1,281 kWh a year on a south-facing roof.
Is solar worth it in Westfield?
Over 25 years, solar power here costs about 12.0¢ per kWh, against 17.0¢ from the grid today. Payback is about 13.5 yrs if your utility credits exported power at the full retail rate, and 21.9 yrs if it pays about 30% of retail.
How many peak sun hours does Westfield get?
4.5 a day on panels tilted to 35°, and 4.0 on flat ground. The best month is Jul; the weakest is Dec.
What is the best angle for solar panels in Westfield?
35° for the most energy over a year, facing south. 62° is best in winter and 11° in summer. On a normal pitched roof, anything within 15° of 35° gives you about 95% of the maximum.
How long would a home battery last in a Westfield power outage?
A Tesla Powerwall 3 running a fridge, freezer, furnace fan, lights, Wi-Fi, TV and microwave (6.9 kWh a day) lasts about 43 hours with no sun. With 7 kW of solar to recharge it, it gets through a three-day outage even in overcast January.
Solar near Westfield
| City | Miles | kWh per kW | Sun hours |
|---|---|---|---|
| Carmel, IN | 5 | 1,295 | 4.5 |
| Noblesville, IN | 8 | 1,295 | 4.5 |
| Fishers, IN | 11 | 1,294 | 4.5 |
| Lawrence, IN | 15 | 1,294 | 4.5 |
| Indianapolis, IN | 18 | 1,294 | 4.5 |
Westfield shares a weather-data neighbourhood with Indianapolis; their sunshine numbers differ by less than our data can resolve. Housing, prices and outage figures are specific to Westfield.
Cities with the same sunshine as Westfield
These far-away cities get almost exactly as much solar energy per panel.
- Boston, MA 1,297 kWh per kW
- Missoula, MT 1,295 kWh per kW
- New Brunswick, NJ 1,294 kWh per kW
Snow: NASA records about 15 cm of snow on the ground here in an average January. Covered panels make little until it slides off, and these figures (like PVWatts') don't subtract that.
Sources: NASA POWER 2001–2020 monthly climatology (grid cell 59 km from Westfield's Census point), our PV model (within 1.6% of NLR PVWatts® on average), U.S. EIA prices and use, U.S. Census 2025 population estimates and ACS 2020–2024. Estimates for an average home, not a site survey. How we calculate.