Skip to content

Before a solar salesperson sits at your kitchen table, spend one minute here.

Three answers in about a minute, with every assumption showing and a next step you can act on.

Independent: no one can pay to change a number. We never ask for your phone number. Our annual production estimates averaged 3.2% from NLR PVWatts® across 29 U.S. test cities.

Or start with a city: Phoenix · Denver · Seattle · Miami · Boston · Chicago · or pick your state

Solar Plan Builder · solar plan

A typical home in Denver, CO

Sunnier than 75% of U.S. cities


Solar by month vs your use (dashed)Solar-only cost ≈ 9.6¢/kWh over 25 yrs · grid 16.7¢ today
05001.0kJan: 586 kWh (use ≈ 687)Feb: 641 kWh (use ≈ 620)Mar: 807 kWh (use ≈ 687)Apr: 803 kWh (use ≈ 665)May: 829 kWh (use ≈ 687)Jun: 843 kWh (use ≈ 665)Jul: 828 kWh (use ≈ 687)Aug: 804 kWh (use ≈ 687)Sep: 779 kWh (use ≈ 665)Oct: 717 kWh (use ≈ 687)Nov: 588 kWh (use ≈ 665)Dec: 535 kWh (use ≈ 687)JFMAMJJASOND

Estimate from NASA POWER climatology + the Solar Plan Builder model (annual production estimates averaged 3.2% from NLR PVWatts® across 29 U.S. test cities). Not an engineering site assessment: shade, roof condition, electrical and permitting are not checked. Cost range $2.50–$3.75/W.
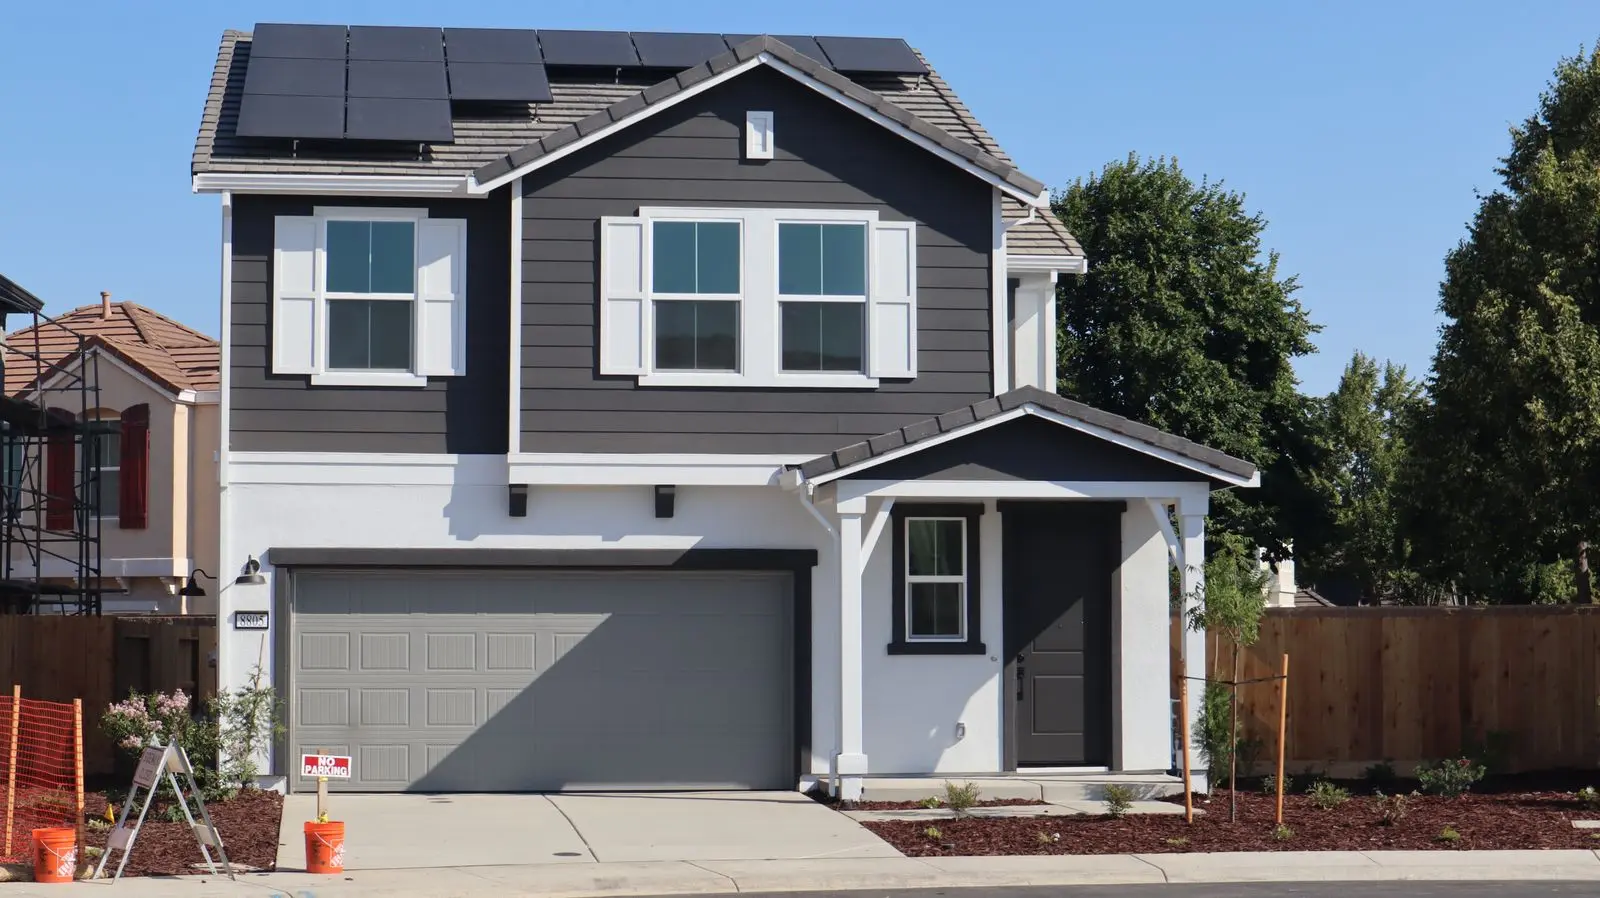
A real plan for an average Denver home, worked out by the same model you are about to use.

Four answers most solar calculators won't give you

  1. A preliminary roof layout. We trace your building from public aerial photos and fit real 420-watt panels with typical fire-code setbacks. If we pick the wrong building, tap yours. An installer confirms placement and clearances on site.
  2. Twelve months, not one number. You see December as well as June, and a typical day hour by hour, so the winter bill doesn't surprise you.
  3. A blackout, simulated. Choose what must stay on (fridge, furnace fan, well pump, CPAP) and watch a battery charge and drain over three days.
  4. The money, with the assumptions showing. Price per watt, payback under your state's export rules, and what solar power costs per kWh against your utility. Change any assumption and the answer changes with it.
Plan my roof

How to go solar without being sold to

10 short chapters in the order you will face each decision, plus a 34-box checklist that prints on two pages.

Eight facts about solar that the ads leave out

1

The 30% federal tax credit is gone.

It no longer applies to systems homeowners buy. Many calculators and some quotes still subtract it.

2

The median home system costs $3.60 a watt.

Cash buyers paid $3.00. Buyers who used a loan paid $4.50: the difference is mostly fees (Lawrence Berkeley National Laboratory).

3

Solar works in Seattle.

A kilowatt of panels makes about 1,150 kWh a year there, against 1,840 in El Paso. Seattle simply needs more panels.

4

Winter matters more than you think.

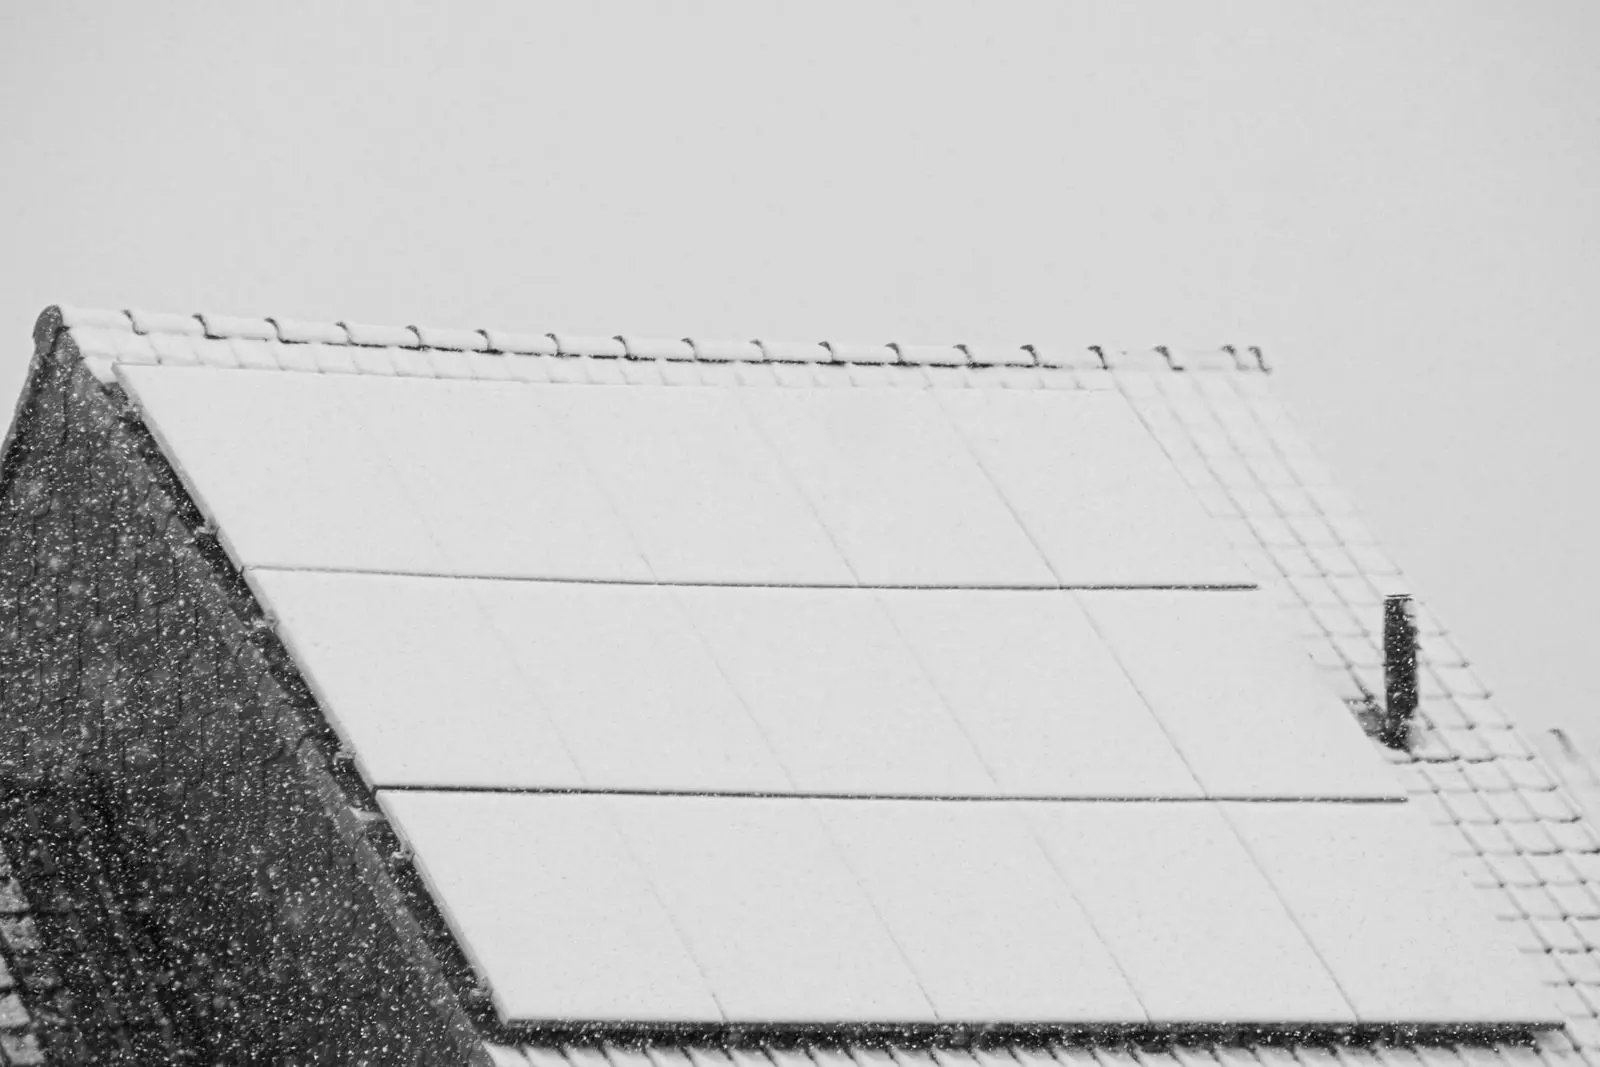
A December day in Seattle makes about a quarter of a June day. In Miami it makes 95%.

5

East and west roofs are fine.

They typically make 80–90% as much as a south-facing roof. North-facing roofs are the problem.

6

Your utility decides half the answer.

In California, Arizona, Idaho, Illinois and parts of North Carolina, exported power earns far less than you pay for power. Payback can stretch by five years or more.

7

37% of new systems came with a battery.

One Tesla Powerwall 3 runs a fridge, furnace fan, lights and Wi-Fi for about two days with no sun.

8

Quotes for the same house can differ by $10,000.

Compare them on price per watt before incentives, and on the kWh they promise.

Where solar makes the most sense, city by city

The glow shows how much power one kilowatt of panels makes in a year, from 20 years of NASA data. Switch to payback or electricity prices, zoom into your area and tap any of 828 cities for its numbers.

All 50 states →
Loading the map…
Sunshine kWh per kW a year
9501,850 kWh per kW
Tap a city · dot size = population

Every number here is checked against the government’s own solar model.

Our model uses NASA climate data and published solar-engineering methods. Across 29 U.S. test cities, our annual production estimates averaged 3.2% from NLR PVWatts® (from -9.5% in Anchorage to +5.5% in Honolulu; slightly low on average). That compares production for a standard test system only, not roof layout, shade, bills or payback. Read the methodology or download the data.

Solar Plan Builder doesn't ask for your phone number. Your plan lives in the link you share, and no one can pay to change a number. About us.

CitySolar Plan BuilderPVWattsDiff.
Seattle, WA1,1031,087+1.5%
Los Angeles, CA1,6821,678+0.3%
Phoenix, AZ1,7491,753-0.2%
Denver, CO1,5711,595-1.5%
Anchorage, AK860950-9.5%
Honolulu, HI1,6711,584+5.5%
Houston, TX1,3891,420-2.2%
Chicago, IL1,2331,332-7.4%
Miami, FL1,4921,557-4.2%
New York, NY1,2751,352-5.7%
Boston, MA1,2501,274-1.8%
Asheville, NC1,3471,374-1.9%

kWh a year from 1 kW of panels facing south at 20°, standard losses. PVWatts uses NSRDB typical-year weather.

Roofus, the Solar Plan Builder mascot

Your roof is waiting. It takes about a minute.

No sign-up, no phone number, nothing stored. Just your address and your electric bill.